What is a correlation matrix?
In simple words, it helps you see which variables move together, which move in opposite directions, and which have almost no relationship.
What is a Correlation Matrix?
A correlation matrix is a table that shows how strongly different variables are related to each other.
In simple words, it helps you see which variables move together, which move in opposite directions, and which have almost no relationship.
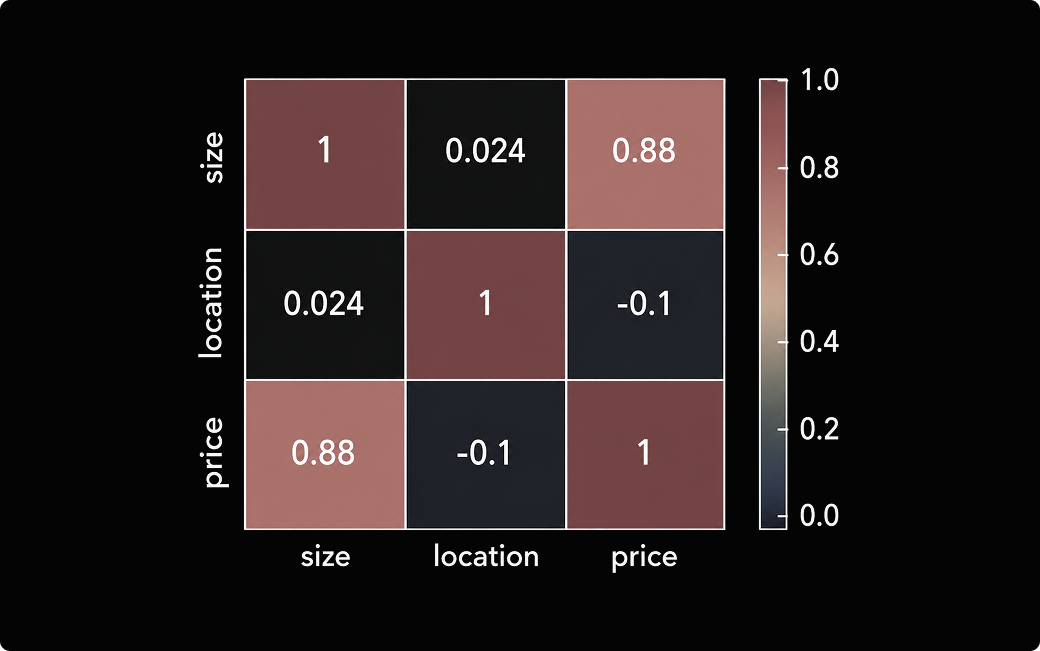
For example, in a dataset about houses, you may have variables like:
- Size
- Location
- Price
A correlation matrix can help you understand questions like:
- Does house size increase with price?
- Does location strongly affect price?
- Are two variables unrelated?
What does correlation mean?
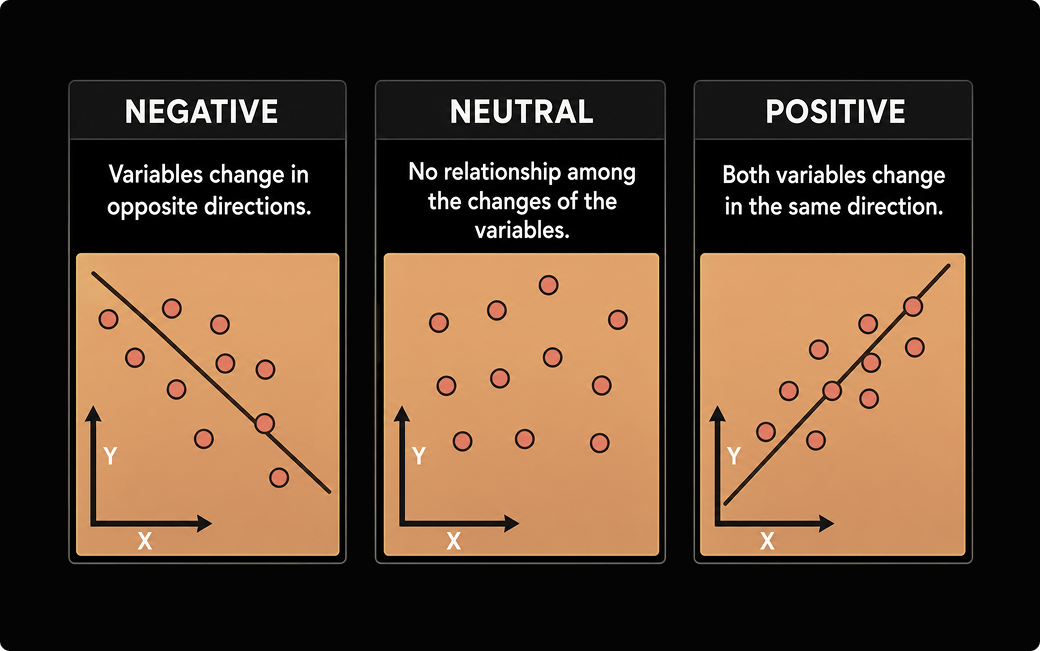
Correlation shows the relationship between two variables.
There are three common types:
- Positive correlation: both variables move in the same direction
- Negative correlation: variables move in opposite directions
- Neutral correlation: there is no clear relationship
For example, house size and price may have a positive correlation. As the size increases, the price may also increase.
But two unrelated things, like house color and price, may have little or no correlation.
How to read a correlation matrix
A correlation matrix usually contains values between -1 and +1.
Here is what the numbers mean:
- +1 means a perfect positive relationship
- 0 means no linear relationship
- -1 means a perfect negative relationship
So if size and price have a correlation of 0.88, it means they are strongly related in a positive way.
If location and price have a correlation of -0.1, it means the relationship is very weak or almost neutral.
Why is it useful in machine learning?
A correlation matrix is useful because it helps you understand your dataset before building a machine learning model.
It can help you:
- Find important relationships between variables
- Detect highly related features
- Understand which variables may affect the target
- Remove duplicate or unnecessary features
- Make better decisions during data analysis
This is usually part of exploratory data analysis, also called EDA.
If you are new to machine learning basics, you may also like Why Understanding AI Basics Is No Longer Optional.
Covariance vs Pearson correlation
Covariance is one way to measure how two variables change together.
But covariance is hard to compare because the value depends on the scale of the variables.
Pearson correlation solves this by normalising the value between -1 and +1.
That is why correlation matrices usually use Pearson correlation.
Final thoughts
A correlation matrix is a simple table that shows pairwise relationships between variables in a dataset.
Each number tells you how strongly two variables move together.
In machine learning, it is a useful tool for understanding data before training a model.
At AI Folks, we help learners understand AI and machine learning concepts in a simple and practical way.
Join the AI Folks community to learn AI engineering step by step.